
1、安装和配置wmi-exporter
1.1 使用helm安装redis-exporter
通过下面的连接:https://github.com/martinlindhe/wmi_exporter/releases/download/v0.10.2/wmi_exporter-0.10.2-amd64.exe
下载wmi_exporter-0.10.2-amd64.exe,并将名称改为wmi_exporter.exe。在本文中,将wmi_exporter.exe放置在”d:\”目录下,通过执行下面的命名将wmi_exporter.exe注册成windows系统服务。
sc create wmi_exporter binpath= "d:\wmi_exporter.exe" start= auto
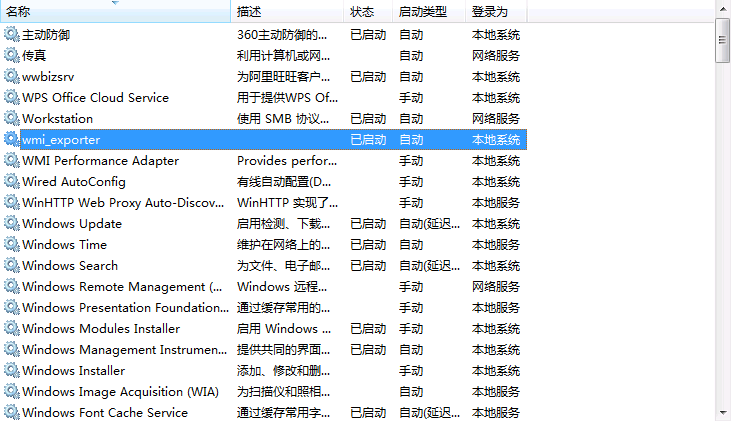
1.2 查看Windows操作系统的指标数据
在浏览器中访问:http://{ip}:9182,能够看到所要监控的指标。

2、Prometheus监控
2.1 配置Prometheus
在Prometheus的配置文件(Prometheus.yaml)中,添加红色字体部分的内容。
global:
scrape_interval: 15s # Set the scrape interval to every 15 seconds. Default is every 1 minute.
evaluation_interval: 15s # Evaluate rules every 15 seconds. The default is every 1 minute.
# scrape_timeout is set to the global default (10s).# Alertmanager configuration
alerting:
alertmanagers:
– static_configs:
– targets:
# – alertmanager:9093# Load rules once and periodically evaluate them according to the global ‘evaluation_interval’.
rule_files:
# – “first_rules.yml”
# – “second_rules.yml”# A scrape configuration containing exactly one endpoint to scrape:
# Here it’s Prometheus itself.
scrape_configs:
# The job name is added as a label `job=<job_name>` to any timeseries scraped from this config.
– job_name: ‘prometheus’# metrics_path defaults to ‘/metrics’
# scheme defaults to ‘http’.static_configs:
– targets: [‘localhost:9090’]# 配置从redis-exporter中获取数据,目标地址为:10.0.32.148:9182
– job_name: ‘windows-node-001’
static_configs:
– targets: [‘10.0.32.148:9182’]
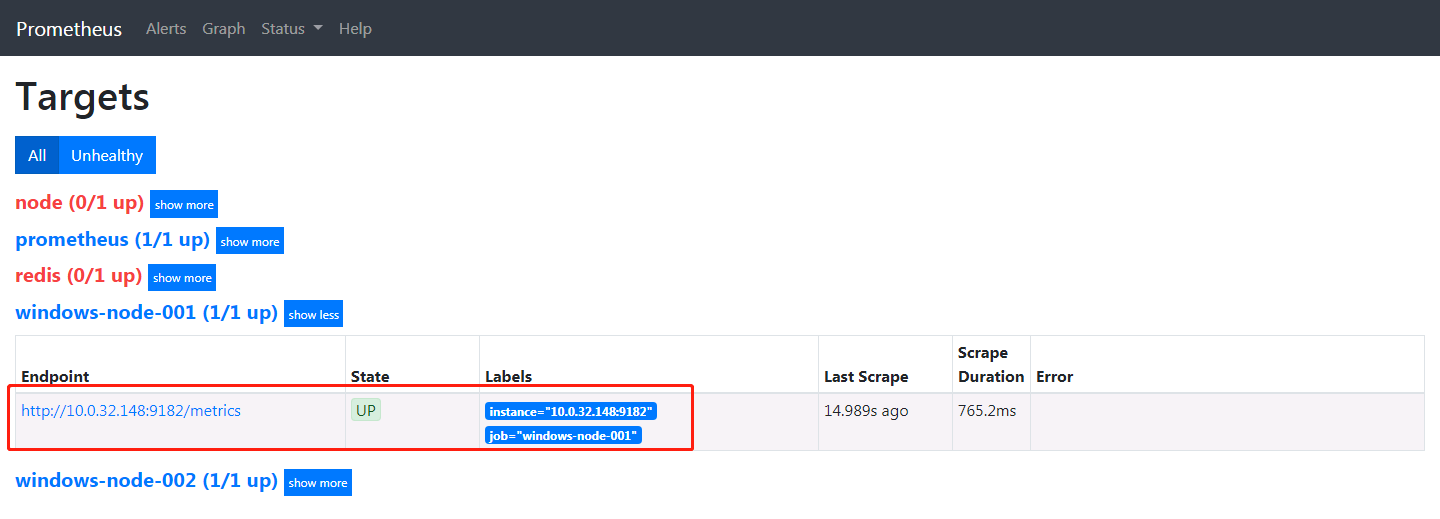
2.2 配置验证
在浏览器的地址栏访问http://{prometheus}/targets,将会看到新配置的redis。
3 Grafana监控
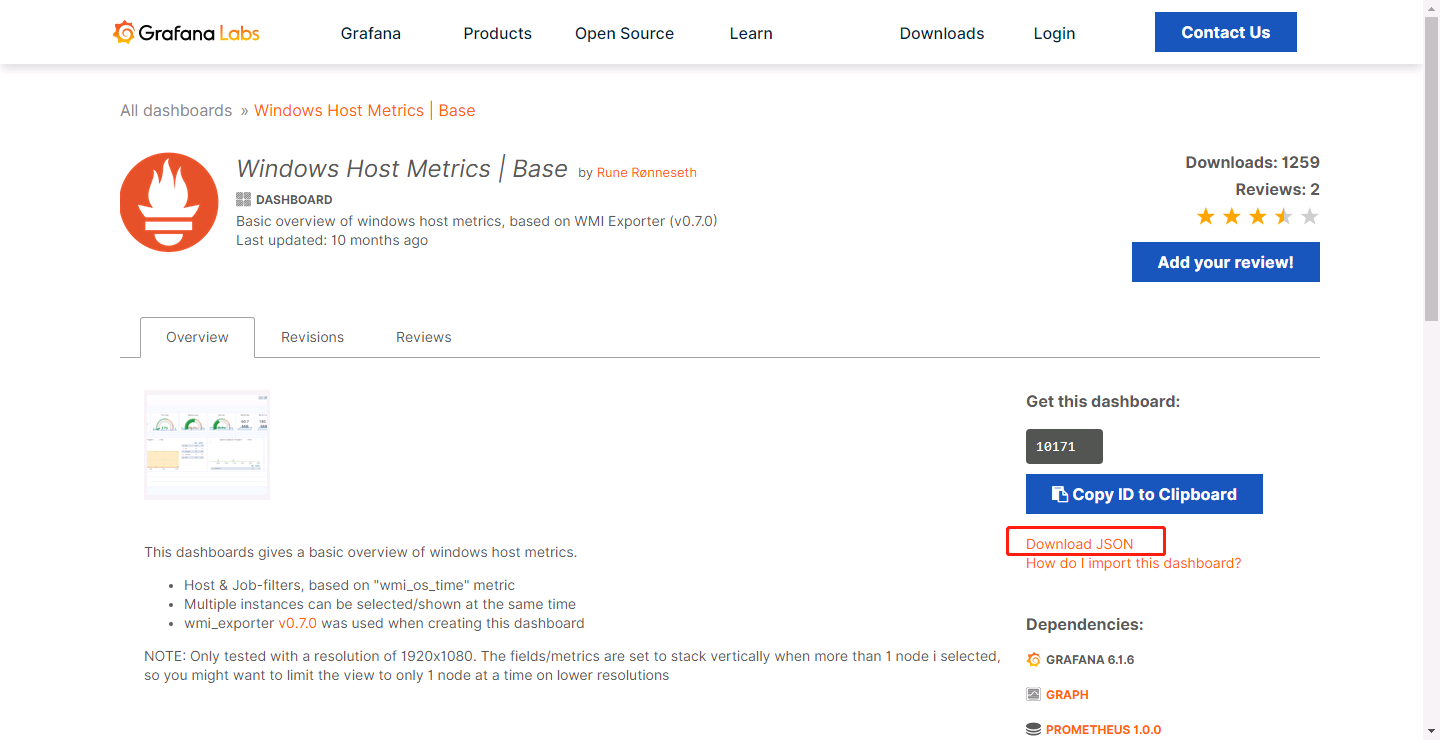
3.1 配置Windows监控dashboard
下载wmi-exporter的dashboard(windows-host-metrics_rev1.json),下载地址:https://grafana.com/api/dashboards/10171/revisions/1/download/
在grafana中导入dashboard:windows-host-metrics_rev1.json。
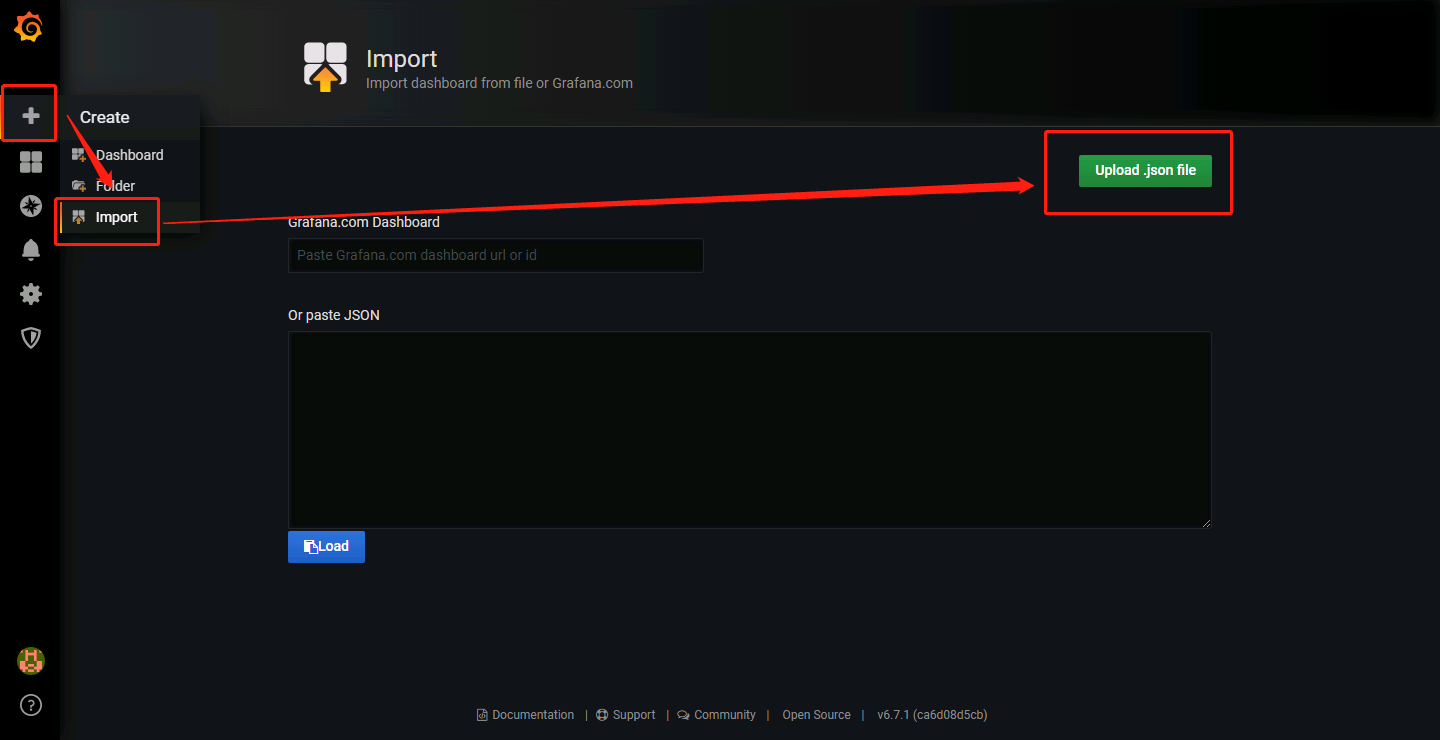
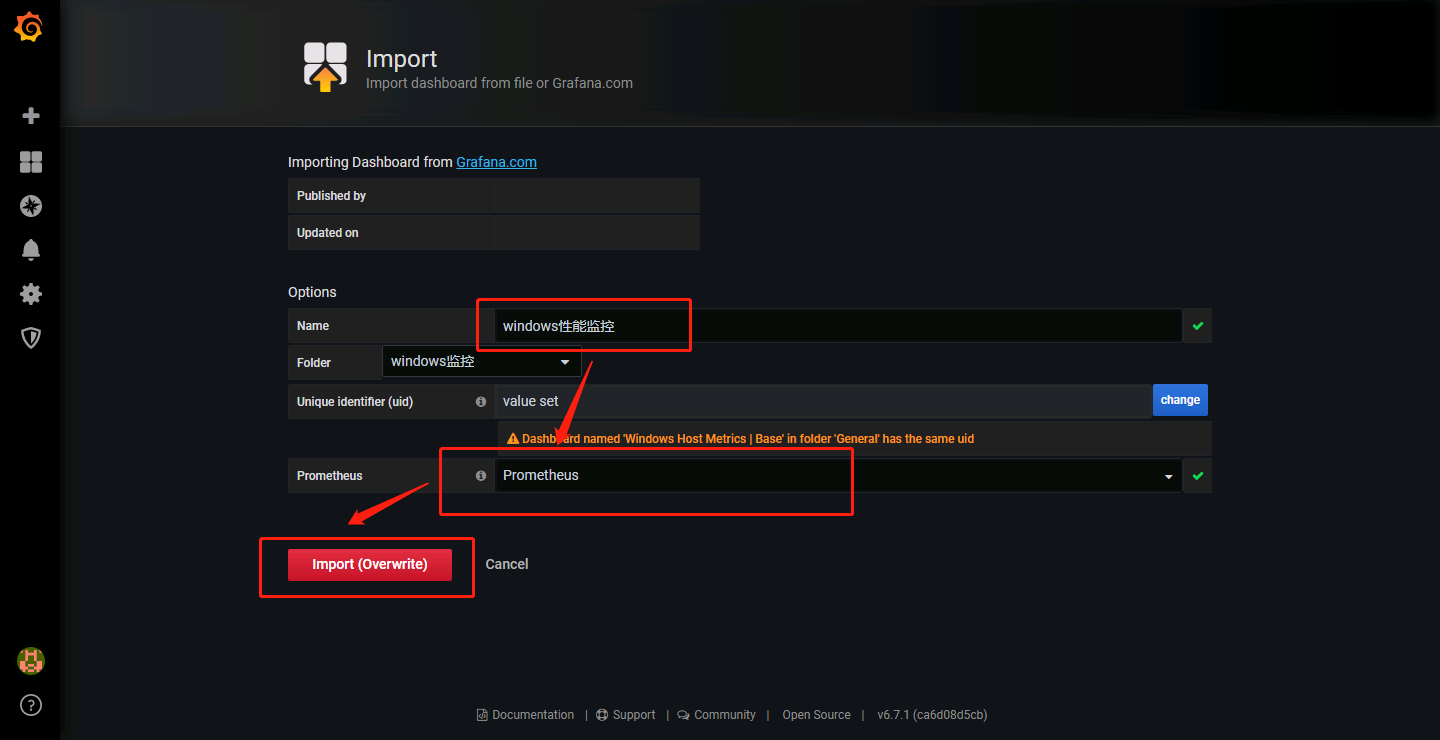
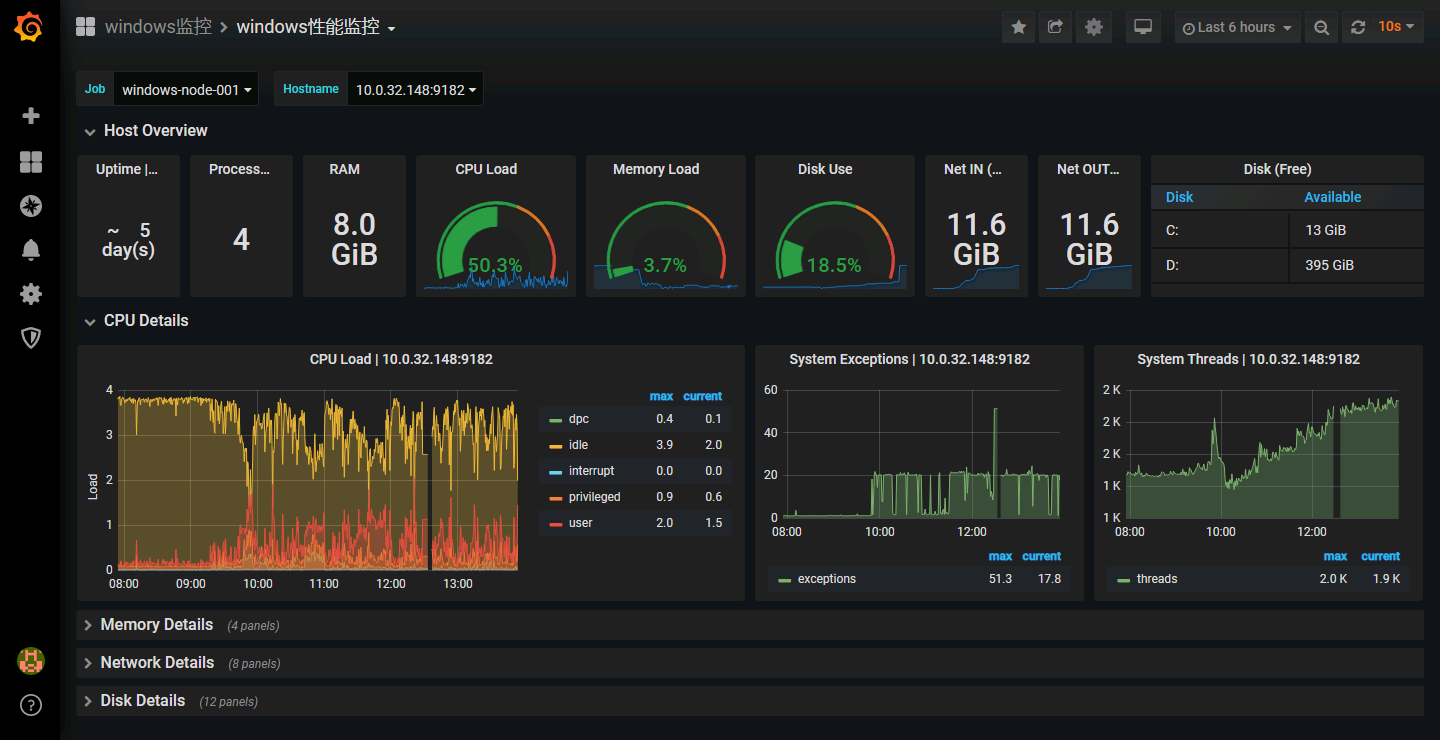
导入后,通过此dashborad,管理员就可以监控Windows操作系统的CPU、内存、磁盘空间、网络等性能指标。
![]()
![]()
作者简介:
季向远,北京神舟航天软件技术有限公司。本文版权归原作者所有。微博:ik8s

登录后评论
立即登录 注册