

在此博客中, 我们来学习使用Spring Actuator,Micrometer,Prometheus和Grafana监控Spring Boot应用程序。你可能觉得这需要大量工作,但是其实很容易!
1.简介
当某个应用程序在生产环境中运行时,监控其运行状况是必要的和明智的。通过实时了解应用程序的运行状况,你能在问题出现之前得到警告,也可以在客户注意到问题之前解决问题。在本文中,我们将创建一个Spring Boot应用程序,在Spring Actuator,Micrometer,Prometheus和Grafana的帮助下来监控系统。其中,Spring Actuator和Micrometer是Spring Boot App的一部分。

简要说明了不同组件的目的:
- Spring Actuator:在应用程序里提供众多 Web 接口,通过它们了解应用程序运行时的内部状况。有关更多信息,请参见Spring Boot 2.0中的Spring Boot Actuator。
- Micrometer:为 Java 平台上的性能数据收集提供了一个通用的 API,它提供了多种度量指标类型(Timers、Guauges、Counters等),同时支持接入不同的监控系统,例如 Influxdb、Graphite、Prometheus 等。Spring Boot Actuator对此提供了支持。
- Prometheus:一个时间序列数据库,用于收集指标。
- Grafana:用于显示指标的仪表板。
下面,我们将分别介绍每个组件。本文中使用的代码存档在GitHub上。
2.创建示例应用
首先要做的是创建一个可以监控的应用程序。通过Spring Initializr,并添加Spring Boot Actuator,Prometheus和Spring Web依赖项, 我们创建了一个如下所示的Spring MVC应用程序。
@RestController public class MetricsController { @GetMapping("/endPoint1") public String endPoint1() { return "Metrics for endPoint1"; } @GetMapping("/endPoint2") public String endPoint2() { return "Metrics for endPoint2"; } }
启动应用程序:
$ mvn spring-boot:run
验证接口是否正常:
$ curl http://localhost:8080/endPoint1
Metrics for endPoint1
$ curl http://localhost:8080/endPoint2
Metrics for endPoint2
验证Spring Actuator接口。为了使响应信息方便可读,我们通过python -mjson.tool来格式化信息。
$ curl http://localhost:8080/actuator | python -mjson.tool
...
{
   "_links":{
      "self":{
         "href":"http://localhost:8080/actuator",
         "templated":false
      },
      "health":{
         "href":"http://localhost:8080/actuator/health",
         "templated":false
      },
      "health-path":{
         "href":"http://localhost:8080/actuator/health/{*path}",
         "templated":true
      },
      "info":{
         "href":"http://localhost:8080/actuator/info",
         "templated":false
      }
   }
}
默认情况下,会显示以上信息。除此之外,Spring Actuator可以提供更多信息,但是你需要启用它。为了启用Prometheus,你需要将以下信息添加到application.properties文件中。
management.endpoints.web.exposure.include=health,info,prometheus
重启应用程序,访问http://localhost:8080/actuator/prometheus从Prometheus拉取数据,返回了大量可用的指标信息。我们这里只显示输出的一小部分,因为它是一个很长的列表。
$ curl http://localhost:8080/actuator/prometheus
# HELP jvm_gc_pause_seconds Time spent in GC pause
# TYPE jvm_gc_pause_seconds summary
jvm_gc_pause_seconds_count{action="end of minor GC",cause="G1 Evacuation Pause",} 2.0
jvm_gc_pause_seconds_sum{action="end of minor GC",cause="G1 Evacuation Pause",} 0.009
...
如前所述,还需要Micrometer。Micrometer为最流行的监控系统提供了一个简单的仪表板,允许仪表化JVM应用,而无需关心是哪个供应商提供的指标。它的作用和SLF4J类似,只不过它关注的不是Logging(日志),而是application metrics(应用指标)。简而言之,它就是应用监控界的SLF4J。
Spring Boot Actuator为Micrometer提供了自动配置。Spring Boot2在spring-boot-actuator中引入了micrometer,对1.x的metrics进行了重构,另外支持对接的监控系统也更加丰富(Atlas、Datadog、Ganglia、Graphite、Influx、JMX、NewRelic、Prometheus、SignalFx、StatsD、Wavefront)。
更新后的application.properties文件如下所示:
management.endpoints.web.exposure.include=health,info,metrics,prometheus
重启应用程序,并从http://localhost:8080/actuator/metrics中检索数据。
$ curl http://localhost:8080/actuator/metrics | python -mjson.tool
...
{
    "names": [
        "http.server.requests",
        "jvm.buffer.count",
        "jvm.buffer.memory.used",
...
可以直接通过指标名来检索具体信息。例如,如果查询http.server.requests指标,可以按以下方式检索:
$ curl http://localhost:8080/actuator/metrics/http.server.requests | python -mjson.tool
...
{
    "name": "http.server.requests",
    "description": null,
    "baseUnit": "seconds",
    "measurements": [
        {
            "statistic": "COUNT",
            "value": 3.0
        },
        {
            "statistic": "TOTAL_TIME",
            "value": 0.08918682
        },
...
3.添加Prometheus
Prometheus是Cloud Native Computing Foundation的一个开源监控系统。由于我们的应用程序中有一个/actuator/Prometheus端点来供 Prometheus 抓取数据,因此你现在可以配置Prometheus来监控你的Spring Boot应用程序。
Prometheus有几种安装方法,在本文中,我们将在Docker容器中运行Prometheus。
你需要创建一个 prometheus.yml文件,以添加到Docker容器中。
global: scrape_interval:15s scrape_configs: - job_name: 'myspringmetricsplanet' metrics_path: '/actuator/prometheus' static_configs: - targets: ['HOST:8080']
- scrape_interval:Prometheus多久轮询一次应用程序的指标
- job_name:轮询任务名称
- metrics_path:指标的URL的路径
- targets:主机名和端口号。使用时,替换HOST为主机的IP地址
如果在Linux上查找IP地址有困难,则可以使用以下命令:
$ ip -f inet -o addr show docker0 | awk '{print $4}' | cut -d '/' -f 1
启动Docker容器并将本地prometheus.yml文件,映射到Docker容器中的文件。
$ docker run \
    -p 9090:9090 \
    -v /path/to/prometheus.yml:/etc/prometheus/prometheus.yml \
    prom/prometheus
成功启动Docker容器后,首先验证Prometheus是否能够通过 http://localhost:9090/targets收集数据。
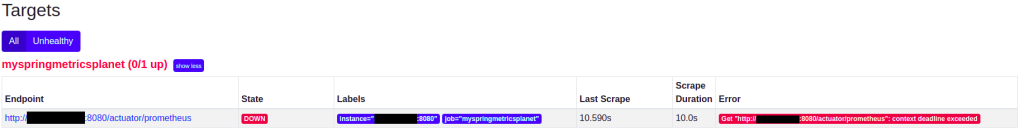
如上图所示,我们遇到context deadline exceeded错误,造成Prometheus无法访问主机上运行的Spring Boot应用程序。如何解决呢?
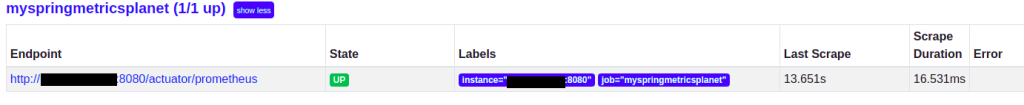
可以通过将Docker容器添加到你的主机网络来解决此错误,这将使Prometheus能够访问Spring Boot应用程序。
$ docker run \
    --name prometheus \
    --network host \
    -v /path/to/prometheus.yml:/etc/prometheus/prometheus.yml \
    -d \
    prom/prometheus
再次验证,状态指示为UP。
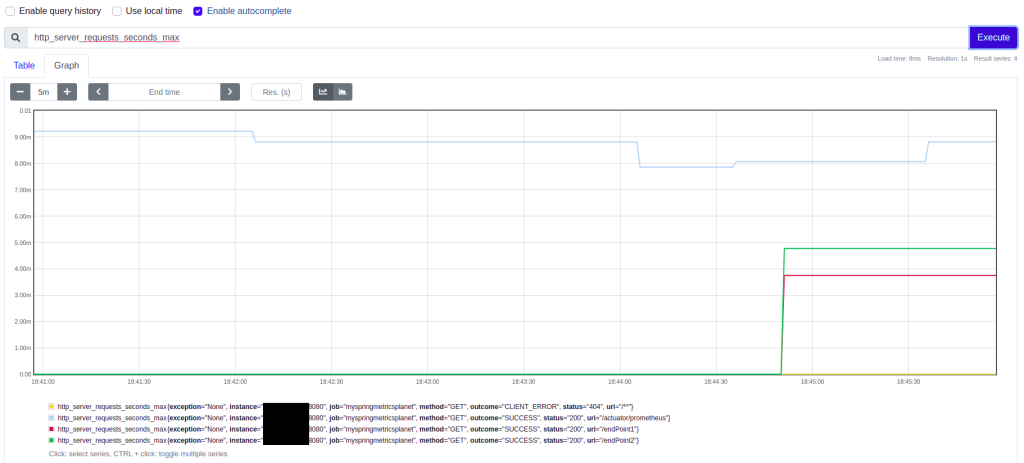
现在可以显示Prometheus指标。通过访问http://localhost:9090/graph,在搜索框中输入http_server_requests_seconds_max并单击“执行”按钮,将为你提供请求期间的最长执行时间。
4.添加Grafana
最后添加的组件是Grafana。尽管Prometheus可以显示指标,但Grafana可以帮助你在更精美的仪表板中显示指标。Grafana也支持几种安装方式,在本文中,我们也将在Docker容器中运行它。
$ docker run --name grafana -d -p 3000:3000 grafana/grafana
点击 http://localhost:3000/,就可以访问Grafana。
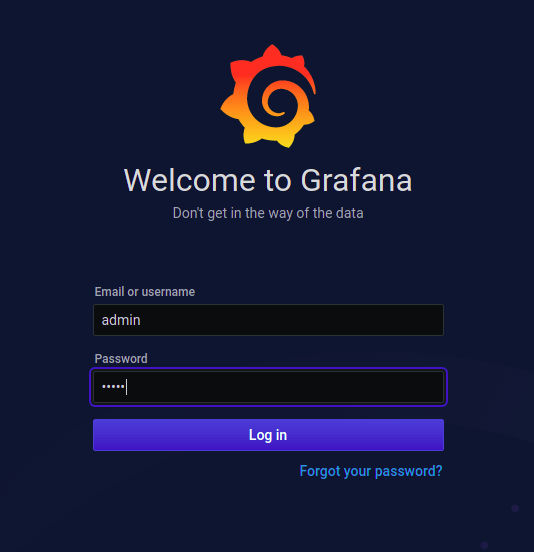
默认的用户名/密码为admin/admin。单击“登录”按钮后,你需要更改默认密码。
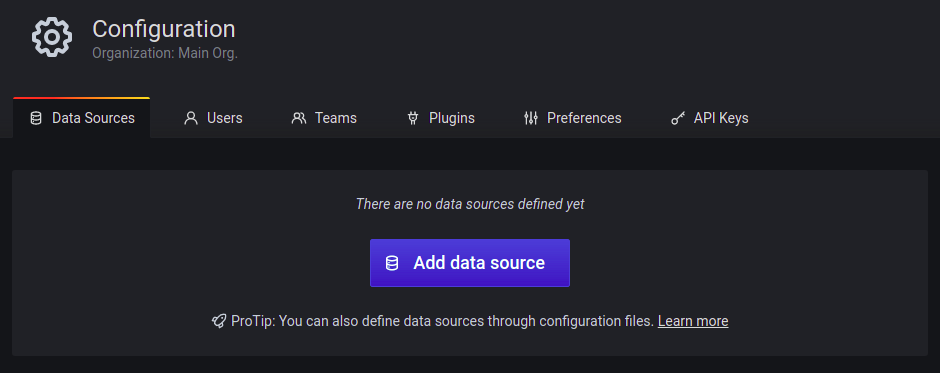
接下来要做的是添加一个数据源。单击左侧边栏中的“配置”图标,然后选择“Data Sources(数据源)”。
![]()
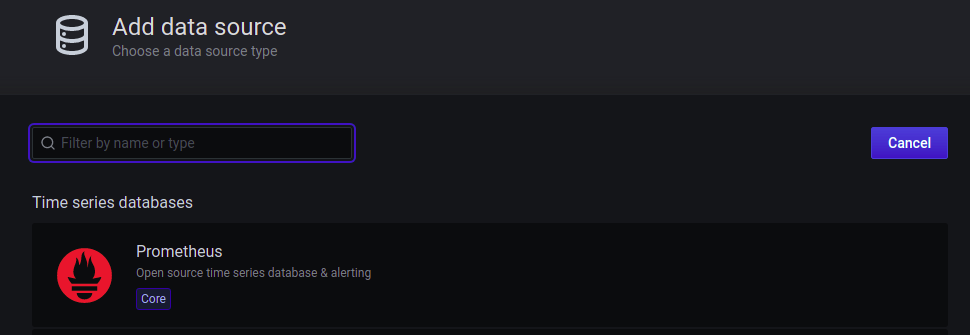
单击Add data source(添加数据源)按钮。
Prometheus在列表的顶部,选择Prometheus。
填写可访问Prometheus的URL,将HTTP Access设置为Browser,然后单击页面底部的Save&Test按钮。
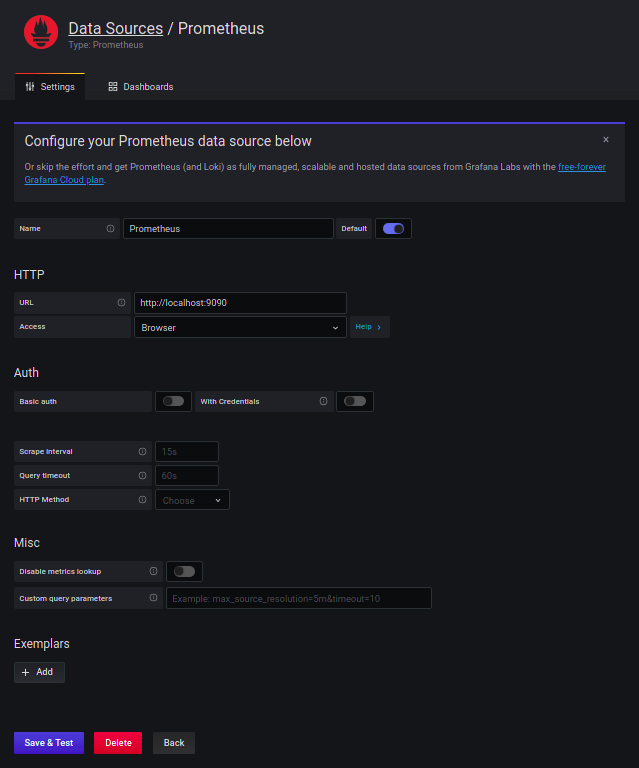
一切正常后,将显示绿色的通知标语,指示数据源正在工作。

现在该创建仪表板了。你可以自定义一个,但也可以使用开源的仪表板。用于显示Spring Boot指标的一种常用仪表板是JVM仪表板。
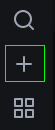
在左侧边栏中,点击+号,然后选择导入。
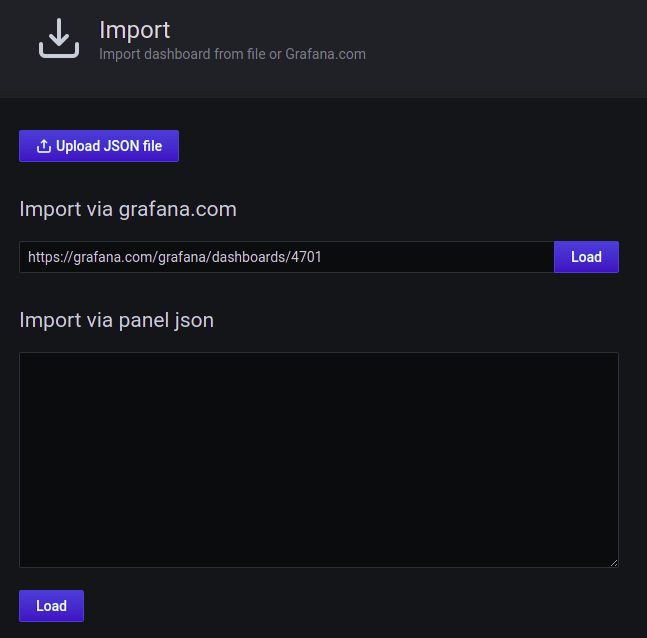
输入JVM仪表板的URL https://grafana.com/grafana/dashboards/4701,然后单击“Load(加载)”按钮。
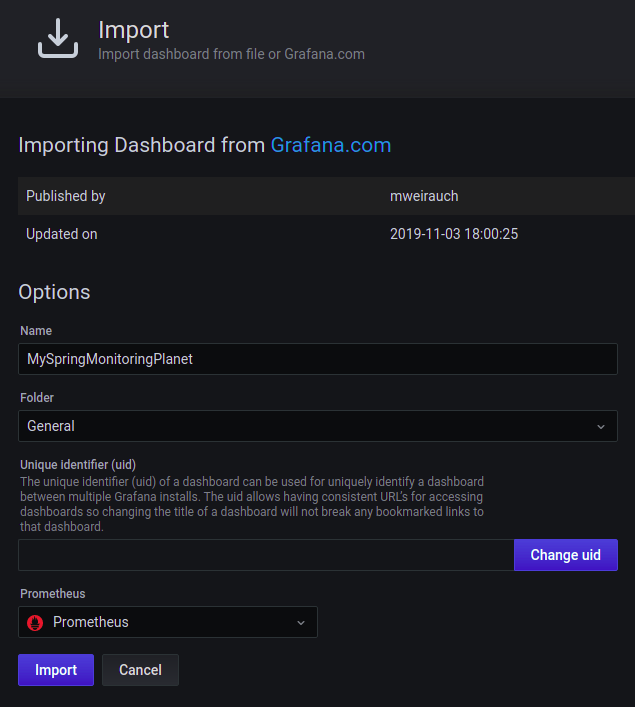
为仪表板输入一个有意义的名称(例如MySpringMonitoringPlanet),选择Prometheus作为数据源,然后单击Import按钮。
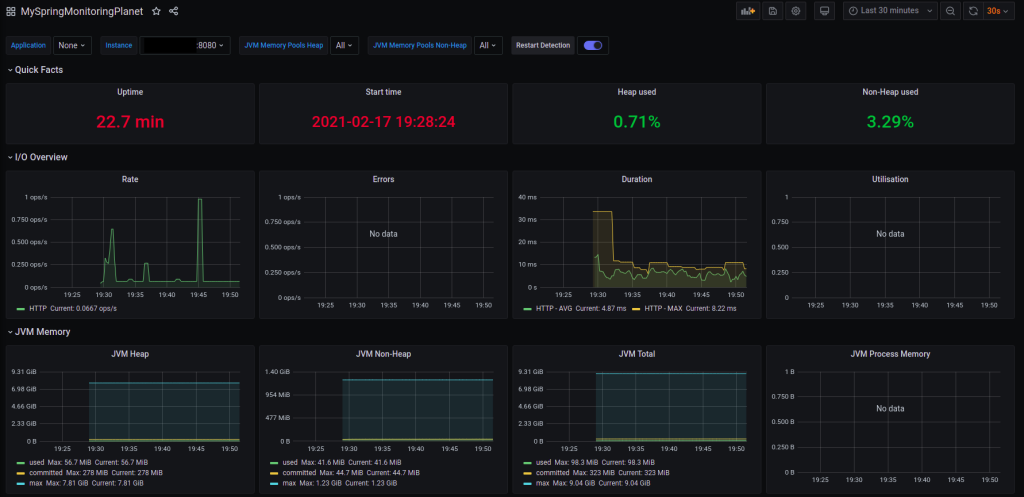
到目前为止,你就可以使用一个很酷的Grafana仪表板。
也可以将自定义面板添加到仪表板。在仪表板顶部,单击Add panel(添加面板)图标。
![]()
单击Add new panel(添加新面板)。

在Metrics 字段中,输入http_server_requests_seconds_max,在右侧栏中的Panel title字段中,可以输入面板的名称。
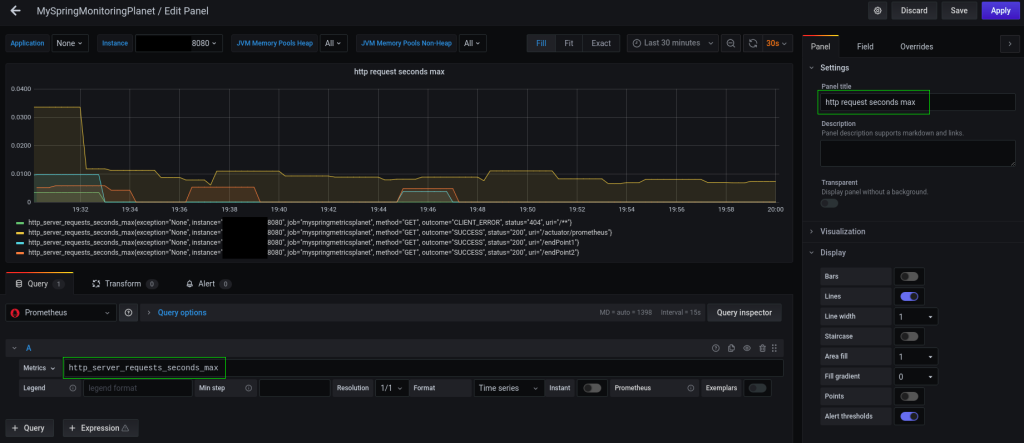
最后,单击右上角的Apply 按钮,你的面板将添加到仪表板。不要忘记保存仪表板。
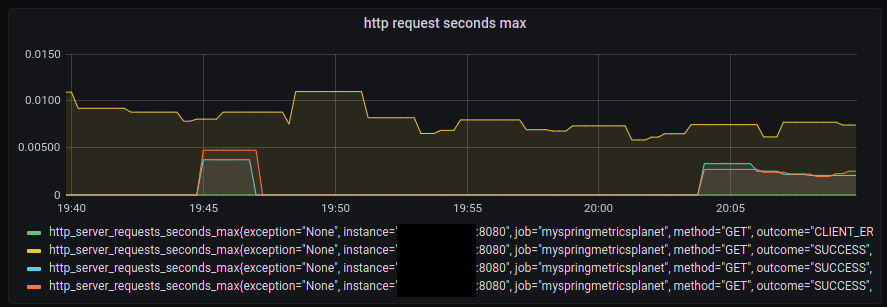
为应用程序设置一些负载,并查看仪表板上的http_server_requests_seconds_max指标发生了什么。
$ watch -n 5 curl http://localhost:8080/endPoint1
$ watch -n 10 curl http://localhost:8080/endPoint2
5.结论
在本文中,我们学习了如何为Spring Boot应用程序添加一些基本监控。这非常容易,只需要通过将Spring Actuator,Micrometer,Prometheus和Grafana组合使用。当然,这只是一个起点,但是从这里开始,你可以为Spring Boot应用程序扩展和配置更多、更具体的指标。
译文链接: https://mydeveloperplanet.com/2021/03/03/how-to-monitor-a-spring-boot-app/

登录后评论
立即登录 注册